The size of the coffee particles in a dose of grounds is one the most important factors in determining the taste of a cup of coffee. Measuring the distribution of those particle sizes is essential for knowing how effective and consistent coffee grinders are.
Both for us at Craft Coffee Spot and for the curious home barista, there are three primary methods for analyzing particle size distribution: sieving, laser diffraction, and image analysis.
In this article, I’ll explain how each method works. I’ll also explain why measuring particle size distribution helps create a great-tasting cup of coffee.
Importance of Particle Size Distribution
Brewing coffee is all about extracting certain compounds (like oils, acids, and sugars) from coffee beans using water. Water can extract these compounds easier with fine-ground coffee than with coarse-ground coffee because fine coffee grounds have more surface area for the water to interact with. This is why different brew methods take a different amount of time to complete. You only need to brew espresso (with very fine grounds) for less than 30 seconds, for example, while a French press (with coarse grounds) takes four minutes.
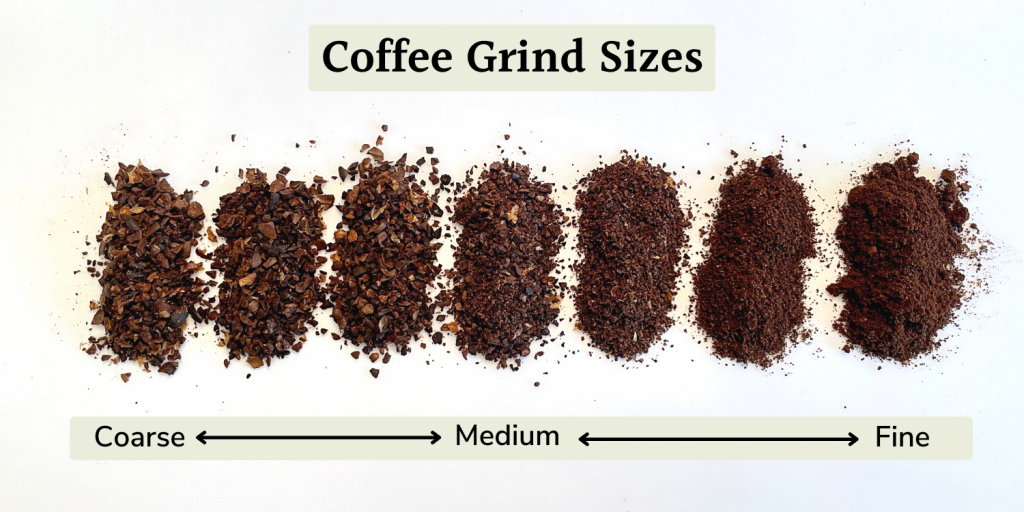
Coffee particle size distribution refers to the mix of coarse and fine particle sizes in any given batch of grounds. Are all of these coffee grounds the same general size, or is there a mix of particles of different sizes?
Different particle sizes create different levels of extraction. So, an uneven grind size distribution leads to an unbalanced cup of coffee. Some particles were extracted perfectly, while some were over-extracted, and others were over-extracted. The variety of extraction levels, all competing with each other, lead to a muddy, uneven flavor. Even grind size distribution means that all the coffee was extracted the same way, so the cup is clean and balanced.
Even then, it’s not so simple as having the same unimodal distribution. Some espresso grinders produce two distinct sets of particle sizes, known as a bimodal distribution. This can enhance flavor with more complexity from larger sizes (that may produce more sharpness) and finer sizes (that may produce more body). Note: I said “can” enhance. It’s not simple and depends on the grinder, burrs, and beans.
This is where measurement comes in. Measuring the distribution of coffee particles is a good way to troubleshoot a coffee that tastes off. This way, we can see if the problem is in our brewing method, our grinder, or somewhere else. It’s one way of quantifying taste with a proper curve.
Measuring grind distribution takes some time, and I have three ways to do it.
How to Measure Particle Size Distribution
Sieving
Using sieves, or sifters, is a simple, if math-heavy, way of checking the particle size distribution of your coffee. A sieve is a metal screen designed with a mesh size that lets very specific particle sizes through the screen. For example, Kruve sifter screens have different sizes that filter our coffee particles of less than 200 microns, less than 300 microns, and so on.

To measure distribution using a sifter, start with the smallest size you want to measure, say 200 microns. First, weigh the total mass of your coffee grounds, for example, 26g. Place all the coffee grounds on the 200-micron sifter over a bowl or container and gently shake it until the coffee stops falling from the sifter. Then, weigh the mass of the coffee particles that fell out of the sifter. Let’s say that the total mass of coffee particles under 200 microns was 1g. Divide that by the total mass you started with (26g), and in this case, the result is 0.038. Multiply that by 100 to turn it into a percentage: 3.8%
This means that 3.8% of the total mass of our coffee grounds was smaller than 200 microns in size. You can repeat this process with different sieves to determine the total size distribution of all coffee particles.
Then you can see how even (or uneven) the grind distribution of your grinder is. For example, 3.8% under 200 microns, 38.4% under 300 microns, 34.6% under 400 microns, and 23.1% under 500 microns, which gives you the distribution.
Here’s an example of this method in action, with some graphs to help visualize the process.
Laser Diffraction
While not as budget-friendly as other methods, laser diffraction is convenient and precise in its process. Laser diffraction equipment is prohibitively expensive, but some labs offer diffraction measurement services for a one-time fee.
Diffraction works by beaming a laser through a sample of ground coffee. As the laser hits the coffee, it bounces off the particles and scatters, or diffracts, before reaching the other end of the sample tube. How different wavelengths of light were scattered can be used to infer the different sizes of the particles in the sample.
The light from the laser reacts differently based on the size of the particle it’s hitting. By measuring the diffraction of the laser, you can determine the properties (like the size) of the coffee it was run through.
Thankfully, a laser diffraction machine will do all that math and analysis for you, and all you have to worry about is paying for the test itself.
Image Analysis
Image analysis is as simple as taking a picture of your coffee grounds and letting a computer tell you what the particle size distribution is. Tools like this Ad Astra application bring together the affordability of sifting with the ease of use of laser diffraction.
To get the most out of it, it helps to have a large white surface, like a table or a sheet of construction paper. Spread the ground coffee on the white surface, making sure to separate individual grounds from each other as much as possible. This is easier with a smaller sample, so only use a few grams of coffee at a time.
Next, take a photo of the grounds.
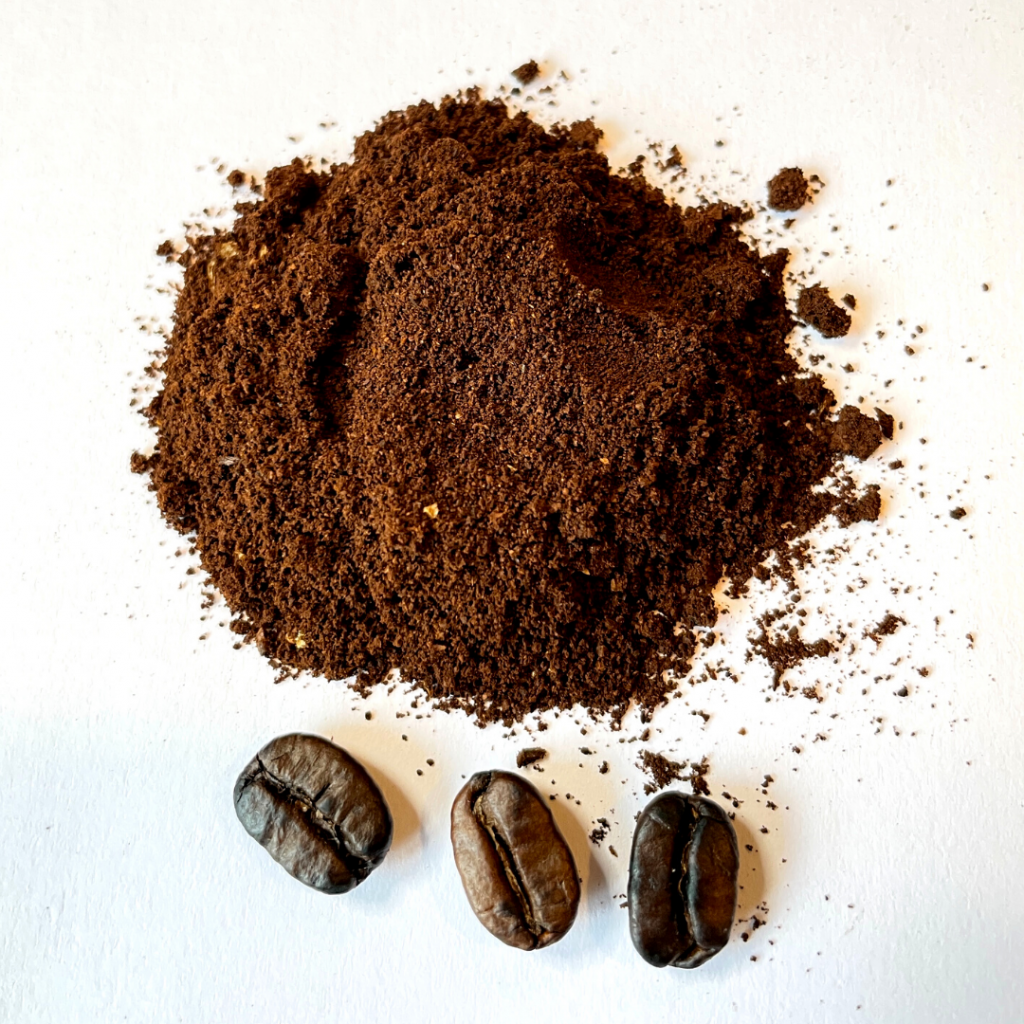
Then, feed it into an image analysis tool. This tool will use the contrast of the dark grounds against the white background to isolate particles. It then determines their size and graphs their distribution. It’s simple to use and provides a visual graph to make deciphering the information more intuitive.
Next Steps
Once you have a grasp of particle size distribution, read through our grinder roundups to see the effects of particle distribution in action.