At Craft Coffee Spot, we’ve researched the coffee statistics market in depth. That includes two original surveys covering 6,500 people, which you can find here and here.
We also rounded up different coffee statistics to give a complete perspective of the coffee market. This article covers 50+ statistics across over a dozen sources. If you’re curious about the coffee market, you aren’t alone. After all, global coffee consumption is 11.8 million tons of roasted coffee per year, which has grown 7.8% over five years. In the US, the average coffee drinker consumes three cups per day, and the country consumes 179 billion cups annually.
We’ve categorized everything by different regions and topics. Grab your espresso or your coffee drink of choice, and get ready to dive in. We also encourage anyone to reach out for our data.
US Coffee Statistics
We found that coffee is extremely popular in the US. It’s America’s favorite beverage, even ahead of bottled water. Here is what we found:
- 65% of Americans drink coffee every day in 2023. Daily coffee consumption increased from 62% in 2020 and declined 1% from 2022. Overall, coffee consumption is steady or increasing over time. (NCA, NCA).
- 70% of Americans drink coffee every week (NCA).
- Consumption per capita remains steady. Americans drink 3 coffee cups a day on average, and 48% coffee drinkers drink between 3 to 5 cups of coffee a day.
- This means Americans drink 491 million cups of coffee per day, and 179 billion cups per year (NCA, Drive Research).
Coffee Shop Statistics
Drinking coffee away from home is very popular in the US, as are larger and unique beverages.
- 91% of people in the US buy coffee at a coffee shop at least once per week, and 37% buy four days a week or more (NCA).
- 48% of daily coffee drinkers buy coffee at a cafe, restaurant, donut shop, or through a drive-through (NCA).
- There are 38,000 coffee shops in the US in 2022. The coffee shop market has grown 8% since 2018 and is expected to grow 5% through 2030 (Craft Coffee Spot).
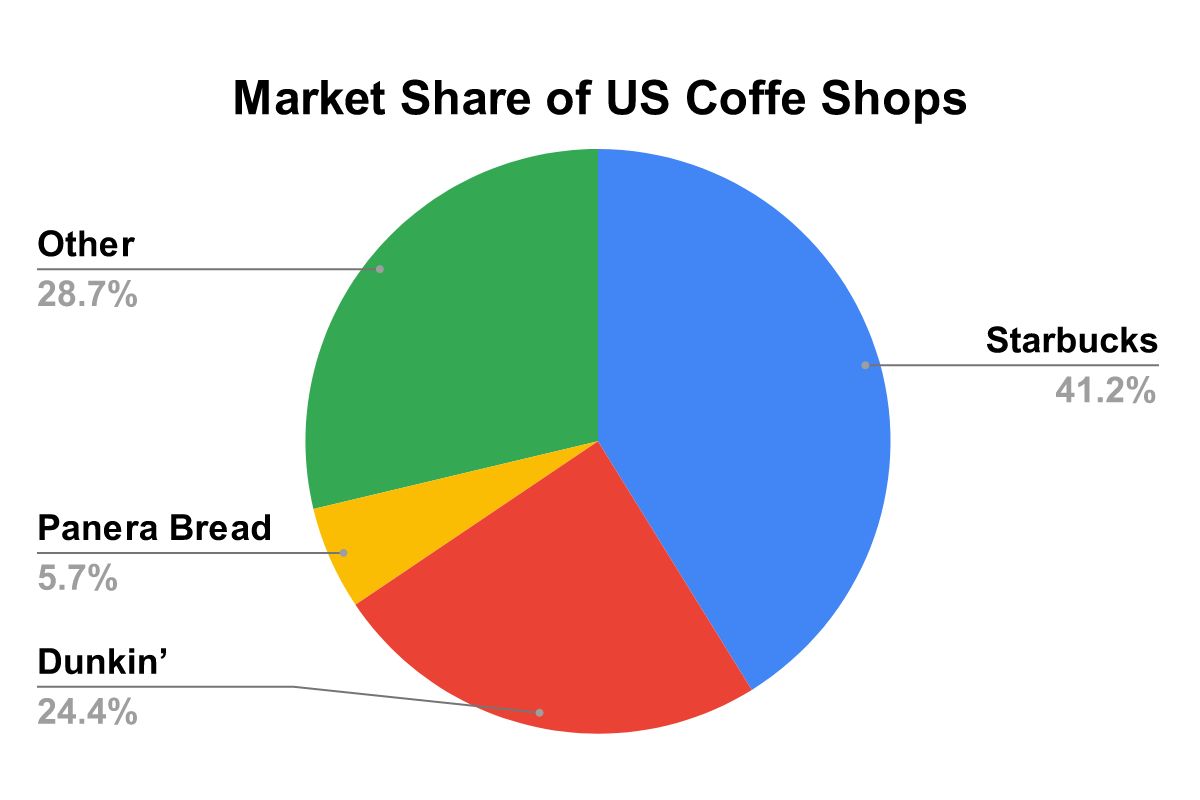
- Just three companies own 71% of coffee shops across the US:
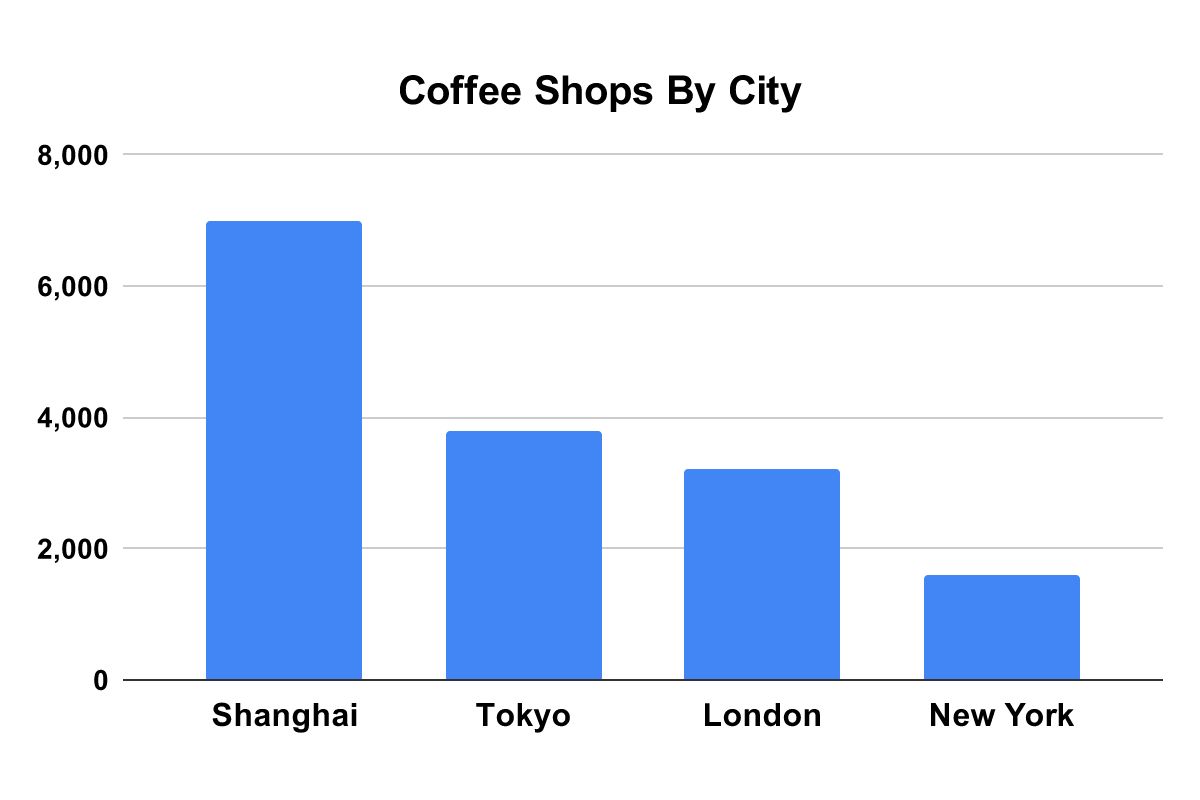
- New York is home to just 1,600 coffee shops, well below London’s 3,200 and Tokyo’s 3,800 (Craft Coffee Spot).
- There are 153,600 baristas employed in the US, assuming two full-time baristas per shift and two shifts per typical coffee shop. This requires extensive barista training given the high turnover in the industry.
- 39% of Americans like Starbucks coffee (Drive Research). Starbucks is the most popular coffee shop in the US in 2022, followed by Folgers and Dunkin’ (Statista).
- 52% of coffee drinkers opt for medium-sized coffee, 12 to 16 oz (NCA).
- 32% of past-day coffee drinkers opted for flavored coffee. The most popular flavor is vanilla, followed by mocha, hazelnut, and caramel (NCA).
- 2022 coffee market revenue in the US was over $85 billion, which is the largest dollar spending worldwide (Statista).
US Coffee Drinking By Region
We did an original survey at Craft Coffee Spot to understand Americans’ coffee-drinking habits by region.
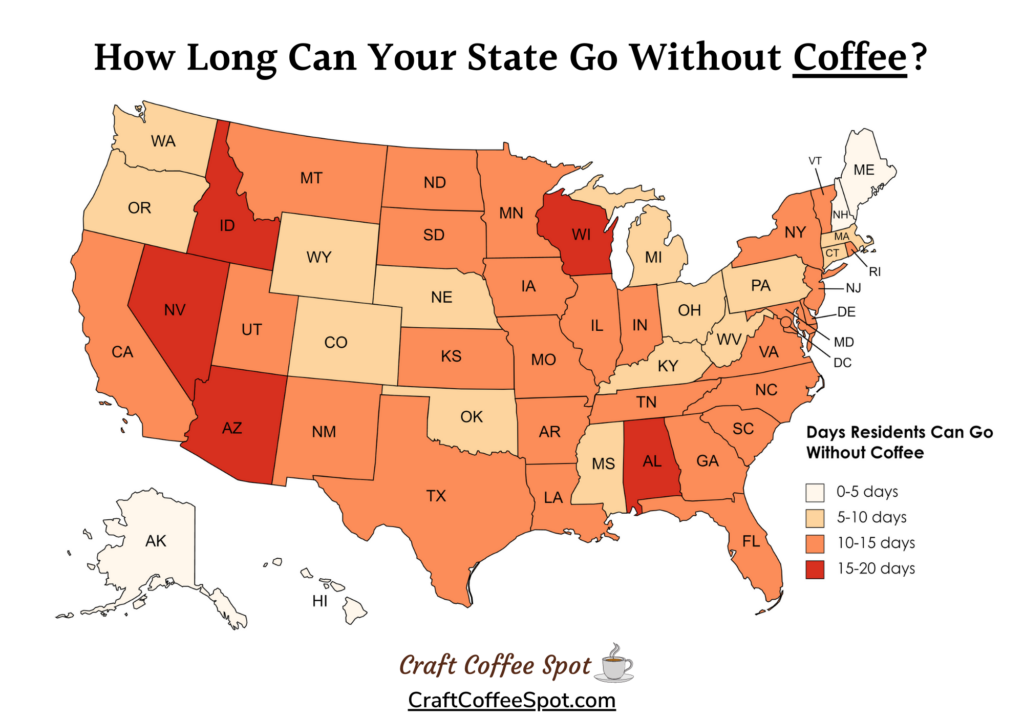
- We found the average American can go 11 days without coffee (Craft Coffee Spot).
- Residents of Idaho can go the longest without coffee — 20 days — while residents of New Hamshire can go the shortest — only 2 days (Craft Coffee Spot).
- US Northeast drank about 1.97 cups of coffee per capita per day. The South drank around 1.8 cups of coffee (Statista).
- US Northeast residents are 15% more likely to have an espresso-based drink than Midwest coffee drinkers (NCA).
- West Coast likes gourmet coffee beans 50% more than the South (NCA).
US Coffee Drinking By Age Groups
We also found coffee consumption increases by age cohort, and younger coffee drinkers are more likely to drink coffee away from home.
- 47% of 18 to 24-year-olds, 67% of 40 to 59 year olds, and 69% of coffee drinkers aged 60+ said they drink coffee (NCA).
- People over 70 drink around 2.18 cups of coffee a day (Statista).
- Seniors drink about three times more coffee cups per day compared to the younger population (Statista).
- More than a third of 18 to 29-year-olds regularly visit a coffee shop, while only a quarter of 50 to 64-year-olds does the same (Statista).
- 40% of respondents aged between 30 and 59 are more likely to use a drip coffee maker (Statista).
- Coffee drinkers over 60 are two times more likely to drink traditional coffee than 18 to 24-year-olds (NCA).
- Americans younger than 40 increased coffee drinking by 40% since 2015 (NCA).
US Coffee Spending
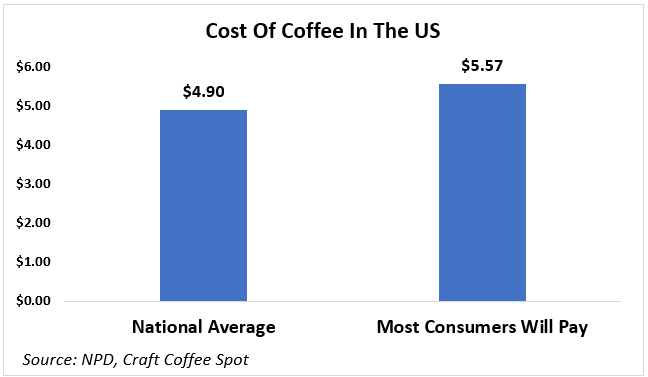
- The average price of coffee in 2022 is $4.90, which is 7.6% jump since 2021 and up from $2.70 in 2015. (Business Insider, WSJ, US News).
- In 1970, the average price for a cup of coffee was $0.25 in the US! (Sage Financial Group).
- An average coffee drinker is willing to pay up to $5.57 for one cup of coffee, which is 16.7% of the average hourly pay (Craft Coffee Spot).
- 2022 coffee market revenue in the US was over $85 billion, which is the largest dollar spending worldwide (Statista).
- An average American spends $1,100 on coffee a year, which is around $92 a month (The Motley Fool).
- Females spend $2,327 on coffee, and males spend $1,934 on coffee yearly (AmeriSleep).
World Coffee Statistics
Global coffee consumption is steadily increasing in a diverse set of countries.
- Total coffee consumption worldwide in 2021/2022 was 178.5 million 60kg bags of coffee. World coffee consumption increased by 4.2% in 2021/2022 and 7.8% over five years (ICO).
- That is 11.8 million tons of coffee consumed globally each year.
- Europe consumed the most coffee, with 55,388 60 kg bags in 2022, followed by Asia and Pacific with 44,162 60 kg bags consumed (ICO).
- Finland consumes the most coffee per person, with the average Finn drinking four cups a day, or 26 lbs of coffee per year (World Population Review).
- UK residents paid the most for imported coffee per lb in 2020 ($12.91), while Polish and the Dutch paid the least ($2.81) (ICO).
Coffee production is steadily increasing with consumption. The following data is from our report on global coffee production and export statistics:.
- Half of the world’s coffee is produced in South America — 82.42 million 60-kilogram bags in 2022 (ICO).
- Brazil is the largest coffee-producing and exporting country, with 36,645 60 kg bags exported in 2022 (Craft Coffee Spot).
- From February 2021 to February 2022, Arabica exports were 80.8 million bags, while Robusta export was 48.6 million bags (ICO).
- 171,268 60 kg bags of coffee were produced worldwide in 2022, which is a deficit of 7,26 bags compared to consumption (ICO).
- 98,559 60 kg bags of Arabica and 72,709 60 kg bags of Robusta were produced worldwide in 2022 (ICO).
At-Home Coffee And Coffee Brewing Methods
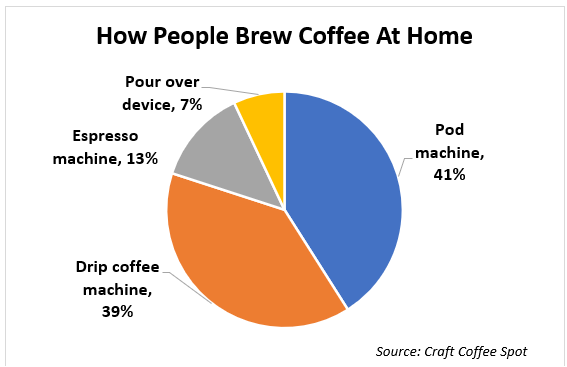
In our surveys and research, there has been a clear shift towards new ways of brewing coffee. The classic “coffee pot” has been in steady decline, as it is replaced by easier single-serve machines or high-end brewing like pour over coffee and espresso machines.
- 41% of coffee drinkers use a pod coffee machine, 39% use a drip coffee maker, 13% use an espresso machine, and 7% prefer pour over coffee (Craft Coffee Spot).
- Americans are 24% less likely to use a drip coffee maker now compared to 2015 (NCA).
- Usage of drip coffee machines is declining, while usage of single-cup coffee machines is up 50% compared to 2015 (NCA).
- Cold coffee was among the top three coffee drinks in the US in 2021 (NCA).
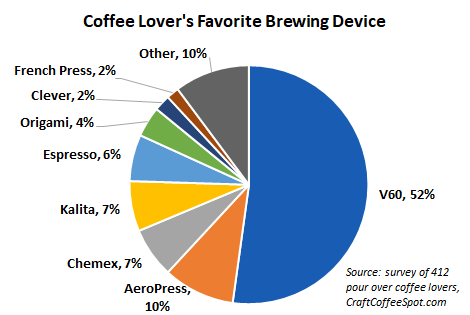
- For pour over coffee brewing methods, 52% prefer the V60, followed by AeroPess at 10% and Chemex at 7%, according to a survey of 412 coffee lovers (Pour Over Coffee Lovers).
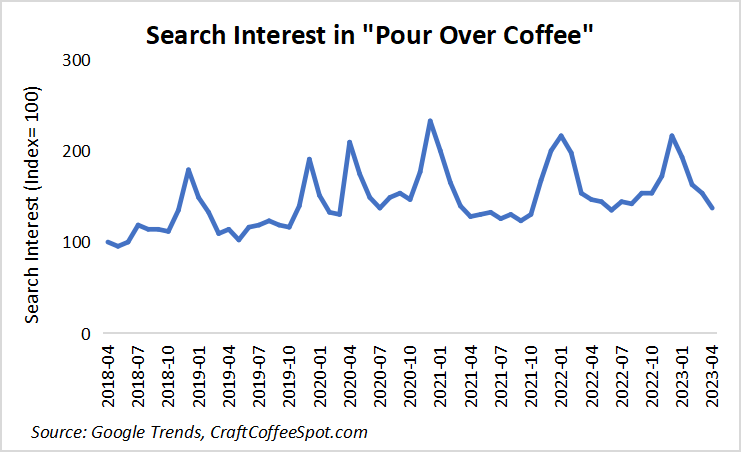
- Search interest in pour-over coffee has grown 37% over five years. However, search interest peaked in early 2021 and has declined by 41% since then. (Google Trends).
Espresso And Espresso Machines
Espresso has rapidly grown in popularity for at home usages. It’s already dominant for coffee shop drinks, but more people are purchasing home espresso machines.
- Espresso, latte, and cappuccino are the most popular coffee beverages (NCA).
- 9% of survey participants in 2020 said they use an espresso machine at home, up from 1% in 2010 and down from 15% in 2017. (Statista).
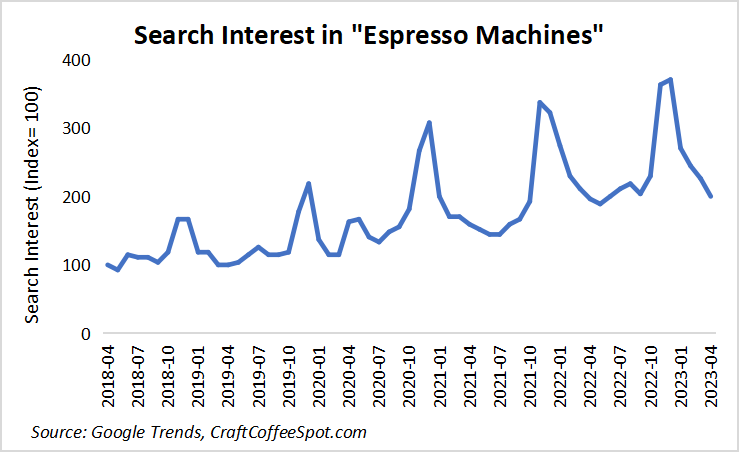
- Search interest in espresso machines has grown by 100% over the past five years (Google Trends).
- Consumption of espresso-based drinks (cappuccinos and lattes) has gone up by 50% since 2015. These drinks are especially popular in the 25 to 39-year-old population (NCA).
- The average barista uses a 1:2 brew ratio for espresso. The average espresso shot is 18 to 20 grams and is extracted in 25 to 30 seconds (Scan news).
- Espresso drinkers are willing to spend for their home setup. 42% of home baristas have a coffee setup worth between $1,000 to $5,000 (Perfect Daily Grind).
Single Serve Coffee Machine Use
Single-serve coffee (aka pod machines) has rapidly grown into the largest at-home coffee market. Consumers value the ease of use of pod machines. We conducted an original survey to understand the market size and environmental impact.
- The single-serve coffee market generated $16 billion in sales in 2021 (Craft Coffee Spot).
- 60 billion coffee pods were consumed in 2021 (Craft Coffee Spot).
- Only 27% of people recycle their coffee pods; the pods thrown away in the trash could make 2,600 full airplanes (Craft Coffee Spot).
- The popularity of single-cup brewing machines has increased by 50% in the last five years (NCA).
- 30% of survey respondents indicated Keurig is their coffee machine brand (Statista).
- Sales of single serve brewers were close to 6 million, while sales of traditional brewers were under 5 million in Q4 of 2020 (Keurig).
- 32% Americans have a coffee maker at work, which is an increase of 6% from January 2021 (NCA).
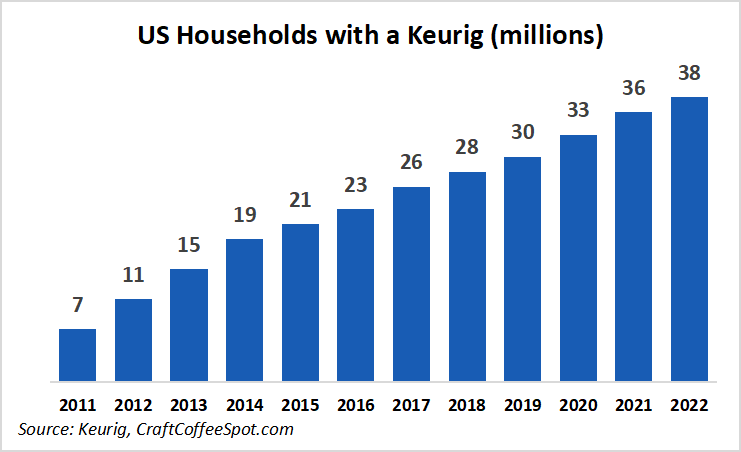
- 38 million households used a Keurig in 2022, up from 7 million in 2011 (Keurig).
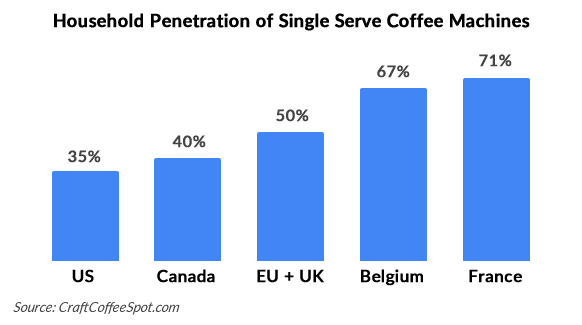
- 35% of US households use a single-serve coffee maker, compared to 40% of Canada, 50% of EU and UK combined, 67% in Belgium, and 71% of households in France (Craft Coffee Spot).
- Nespresso had the same Google searches as Keurig in the past 12 months, according to Google Trends (Google Trends).
Coffee Bean
- 60% of coffee served in the US is made from premium beans. (NCA).
- Robusta beans have a higher caffeine content than Arabica — 2.7% to 1.5% (Hayman Coffee).